Mitch Richling: Chaos Game Levy Curve
| Author: | Mitch Richling |
| Updated: | 2024-10-31 |
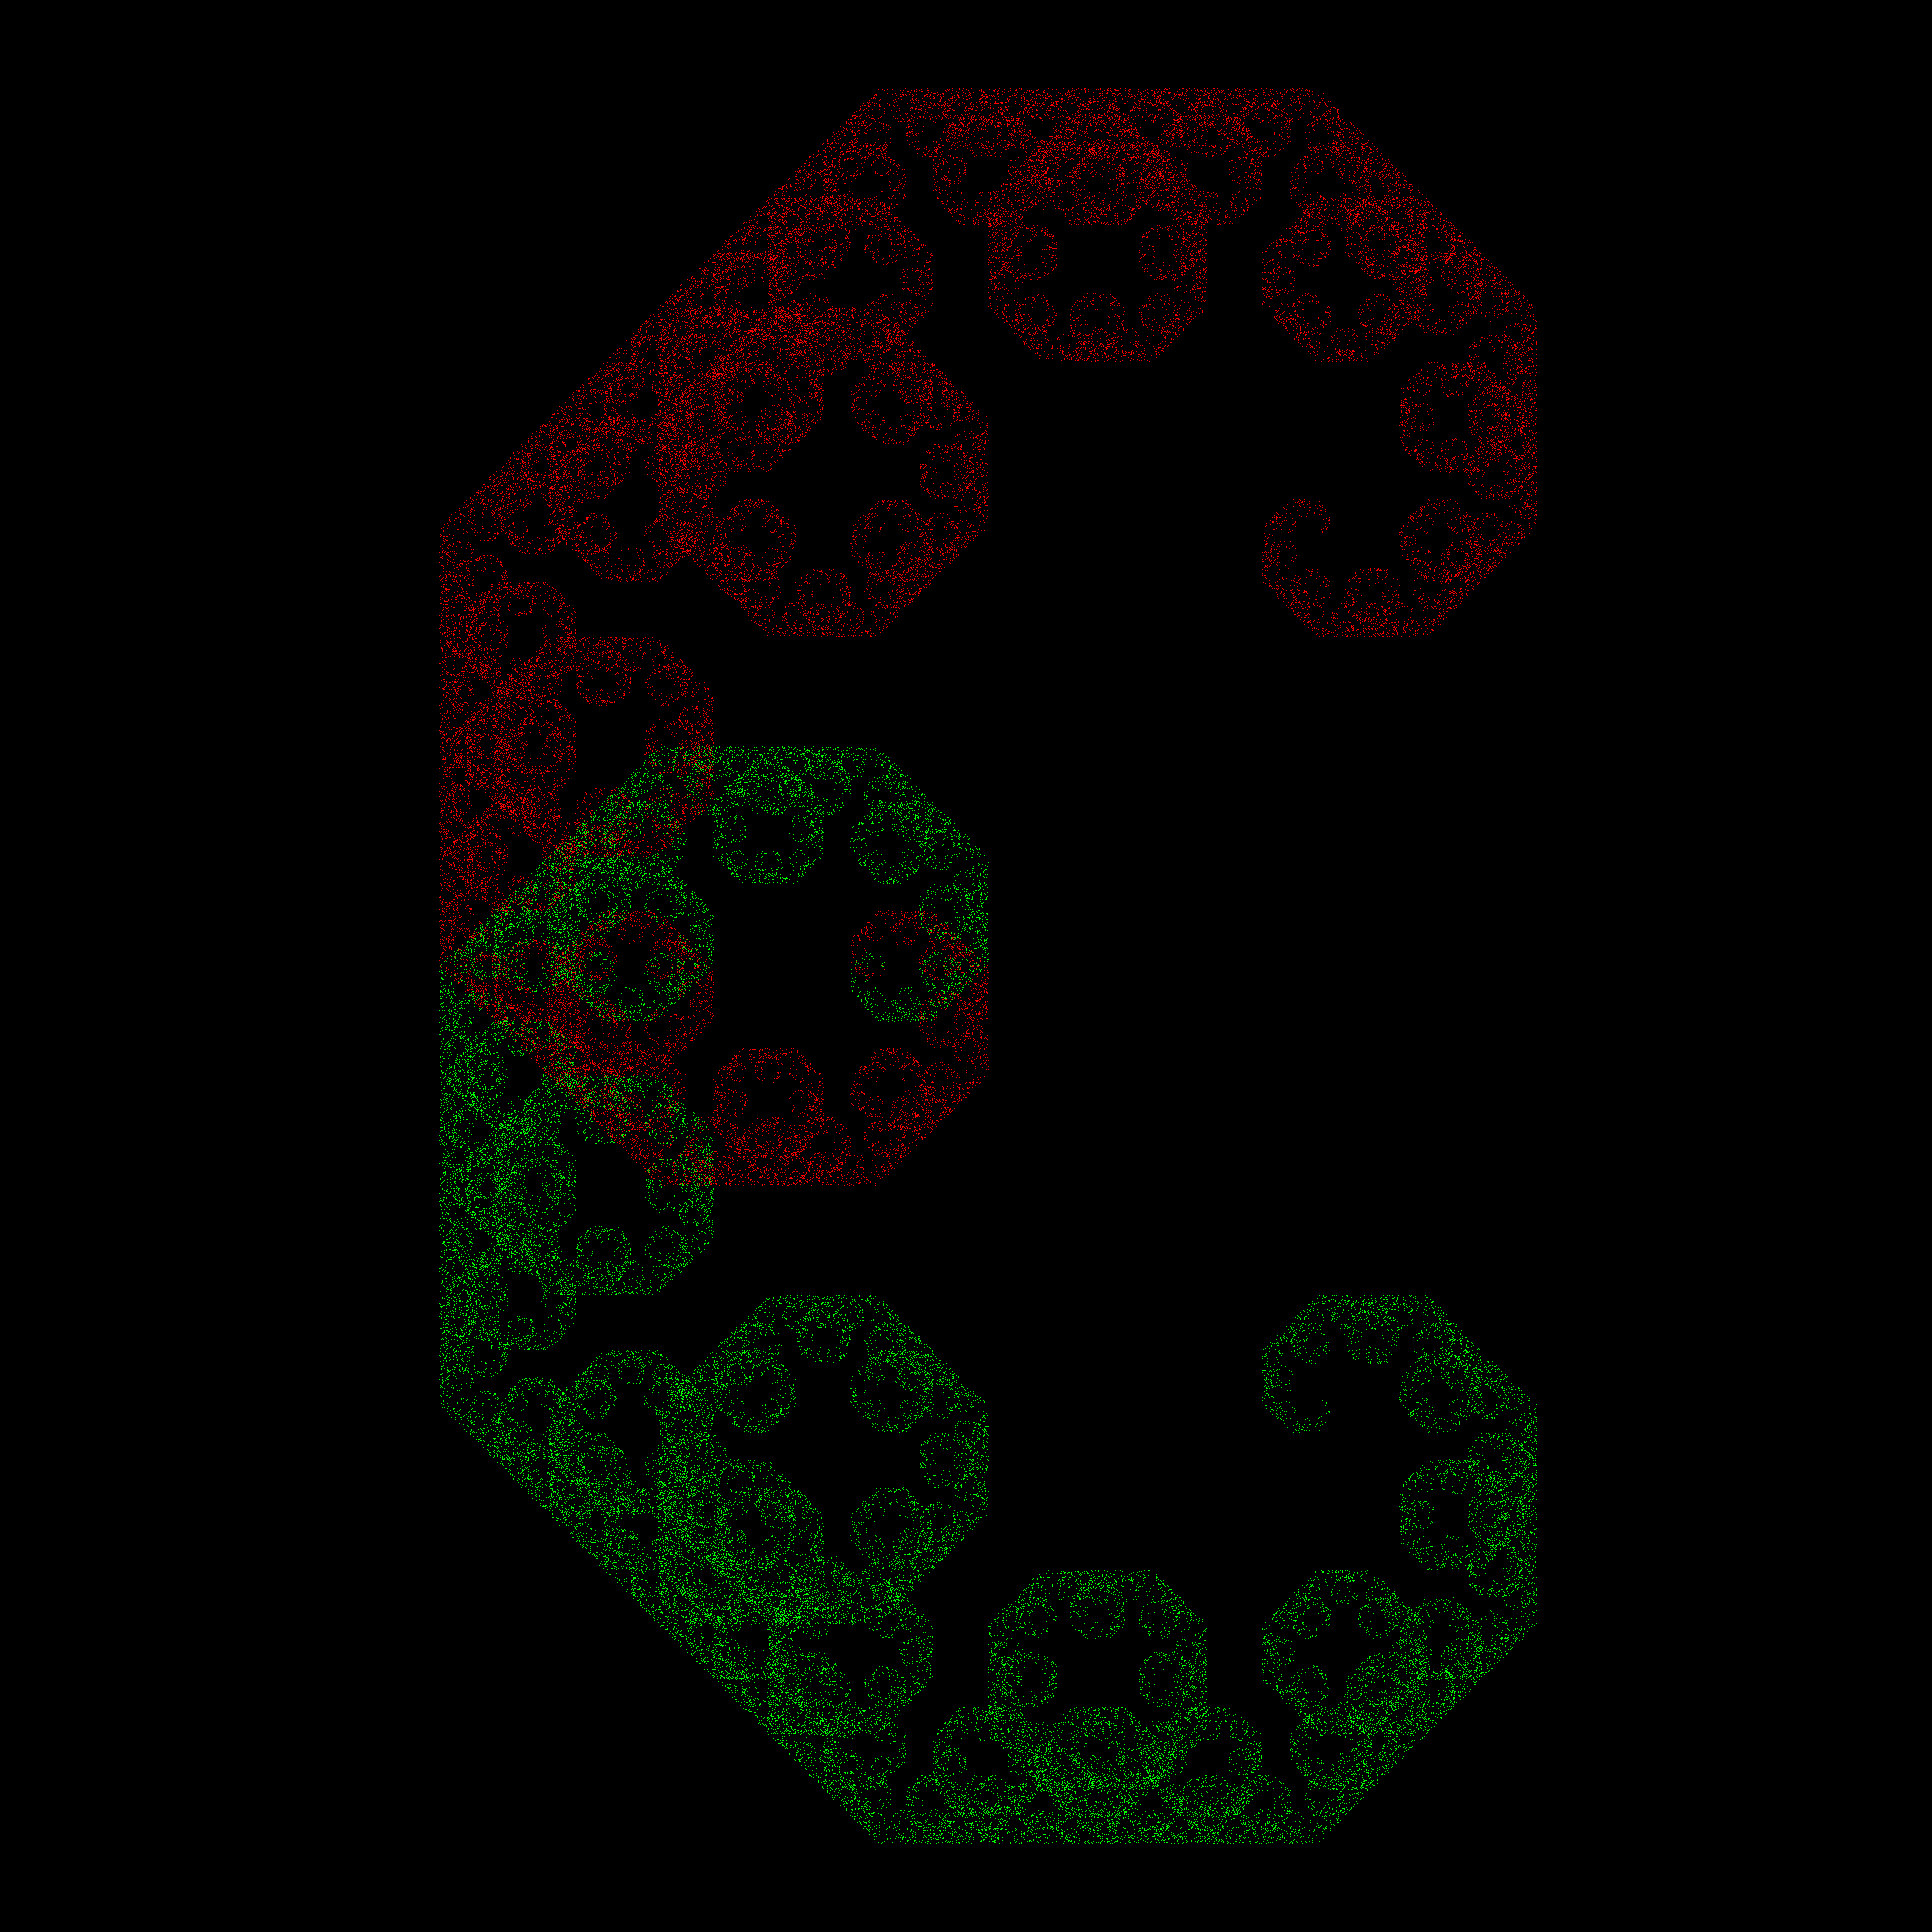
Table of Contents
1. Introduction
This page was inspired by a YouTube video by @MathVisualProofs.
A chaos game that generates a Levy Curve:
Start at a random point. Randomly select one of two transformations, and transform the point. Repeat this process with the new point. The two transformations are given by:
\[ \begin{array}{ll} T_1(\vec{x}) & = \left[ {\begin{array}{rr} \frac{1}{2} & \frac{1}{2} \\ -\frac{1}{2} & \frac{1}{2} \\ \end{array} } \right] \cdot\vec{x} \\ T_2(\vec{x}) & = \left[ {\begin{array}{rr} \frac{1}{2} & -\frac{1}{2} \\ \frac{1}{2} & \frac{1}{2} \\ \end{array} } \right] \cdot\vec{x}- \left[ {\begin{array}{rr} \frac{1}{2} \\ \frac{1}{2} \\ \end{array} } \right] \end{array} \]
We can easily expand these transforms into C code with maxima:
A : matrix([.5,  .5], [-.5, .5]);
B : matrix([.5, -.5], [ .5, .5]);
C : matrix([-.5], [-.5]);
X : matrix([x], [y]);
display2d:false;
A.X;
    matrix([0.5*y+0.5*x],[0.5*y-0.5*x])
B.X+C;
    matrix([(-0.5*y)+0.5*x-0.5],[0.5*y+0.5*x-0.5])
2. Code
#include "ramCanvas.hpp"

int main() {
  std::chrono::time_point<std::chrono::system_clock> startTime = std::chrono::system_clock::now();
  mjr::ramCanvas3c8b theRamCanvas(2048, 2048, -1.5, 0.7, -1.6, .6);

  mjr::ramCanvas3c8b::colorType        acl;
  mjr::point2d<double>                 cpt = {0.0, 0.0};
    for(int n=0;n<100000;n++) {
      if (rand()%2) {
        cpt = { 0.5*cpt.y+0.5*cpt.x,        0.5*cpt.y-0.5*cpt.x };
        acl = mjr::ramCanvas3c8b::colorType::cornerColorEnum::RED;
      } else {
        cpt = { (-0.5*cpt.y)+0.5*cpt.x-0.5, 0.5*cpt.y+0.5*cpt.x-0.5  };
        acl = mjr::ramCanvas3c8b::colorType::cornerColorEnum::GREEN;
      }
      if(n > 100)
        theRamCanvas.drawPoint(cpt, acl);
    }

  theRamCanvas.writeTIFFfile("LevyCurve.tiff");

  std::chrono::duration<double> runTime = std::chrono::system_clock::now() - startTime;
  std::cout << "Total Runtime " << runTime.count() << " sec" << std::endl;

  return 0;
}
Source Link: LevyCurve.cpp
The above program will generate the following image: